That display only helps if people see it
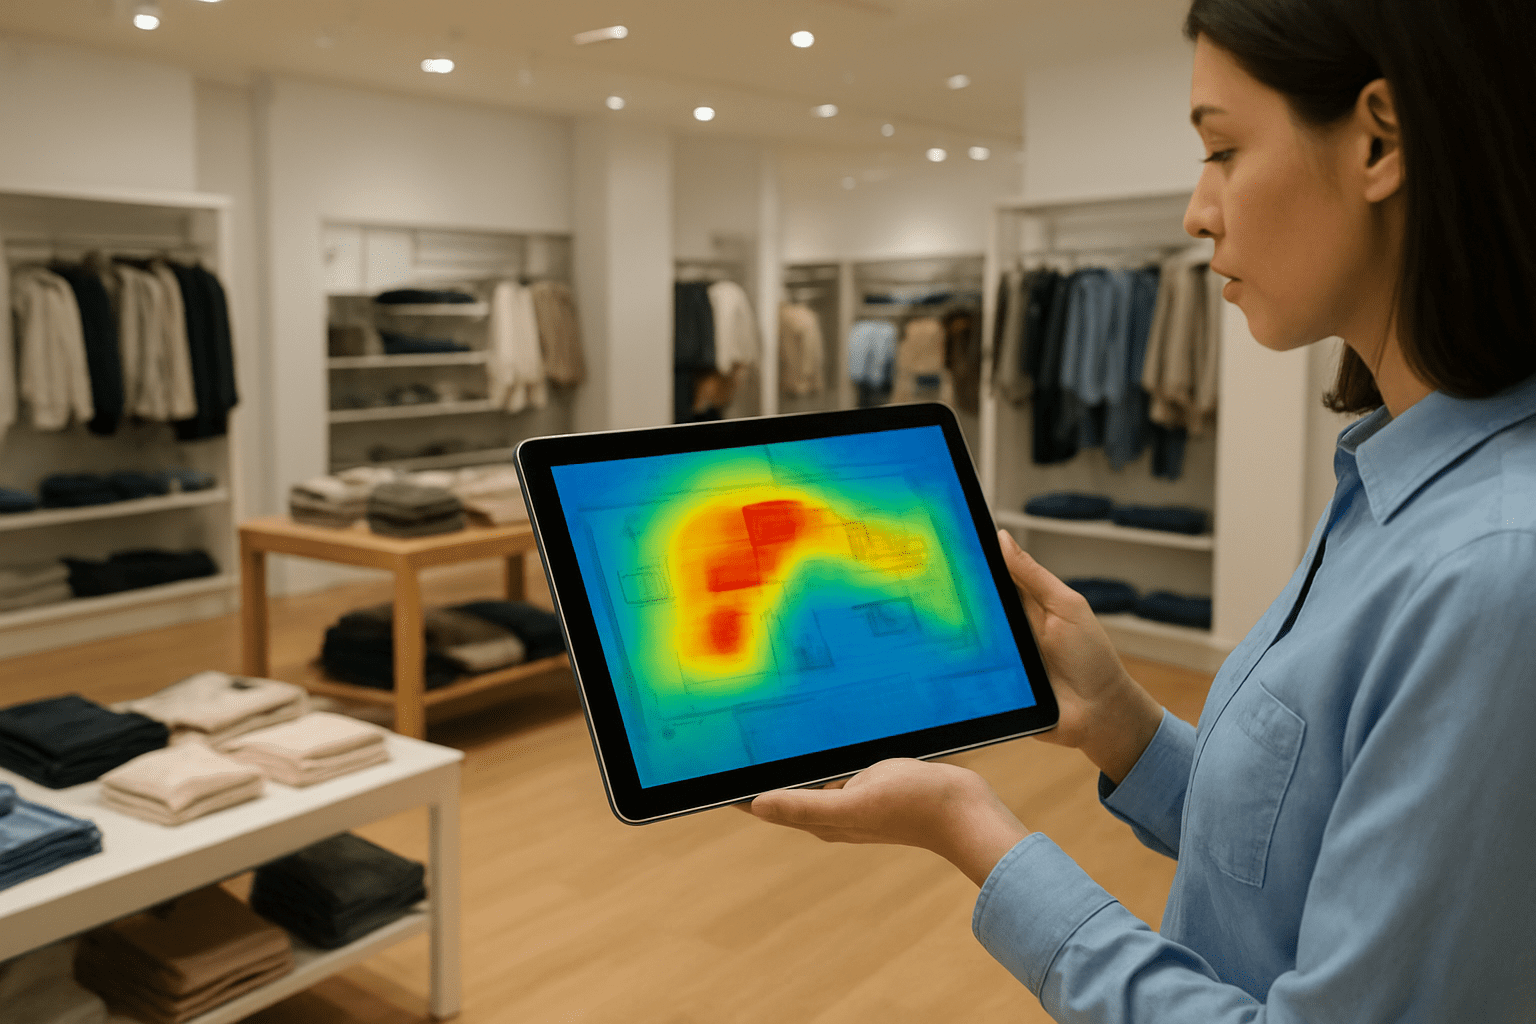
You can build the most beautiful product display in the world — but if it sits in a “dead zone,” it won’t move inventory. Heatmaps and dwell-time analytics change that guesswork into certainty. They show where customers actually walk, stop, and engage — and let visual merchandisers place products where they’ll be noticed, touched, and bought.Heatmaps: the store’s behavioral map
Heatmaps turn foot-traffic into visual intelligence. Instead of anecdote (“I think people come here”), you get a map showing:
- Hot zones — areas with dense footfall and long dwell time
- Cold zones — corridors or corners that get passed by
- Flow paths — natural routes shoppers take between displays and counters
- Bottlenecks — pinch points that slow traffic or block sightlines
These visuals are the foundation for decisions about displays, signage, staff placement, and promotions.
Why layout = sales (the logic in plain terms)
- More people seeing an item → more chances to buy (higher impressions)
- Longer dwell time near a display → higher impulse purchase probability
- Clear flow paths → better navigation to feature or high-margin items
- Reduced bottlenecks → improved shopper experience and conversion
In short: heatmaps help you place opportunity where it actually exists.
Practical ways merchandisers use heatmaps
1. Place hero items in true high-visibility spotsDon’t rely on instinct. Put new launches and high-margin SKUs where the heatmap shows natural dwell.
2. Rescue cold zones with micro-activationsIf a corridor is cold, try a pop-up, perfumed sampling, or an eye-catching vertical banner for a week and measure the uplift.
3. Improve sightlines and signage based on flow pathsIf customers route past a display without noticing it, adjust angles, lighting, or add directional cues from the main flow.
4. Time displays for peak windowsUse hourly heatmaps to schedule staff demos or live activations during peak dwell times — not just general store peaks.
5. Test and iterate (A/B style)Move a display for two weeks and measure dwell-time and sales lift vs the original spot. Heatmaps make A/B viable in physical retail.
Metrics to track (so you know it’s working)
- Dwell time (per zone) — target percent uplift after a layout change
- Impressions (visitors passing a display) — how many people see the display
- Conversion rate (visitors → transactions) by zone/store — conversion tied to traffic
- Average transaction value (ATV) around promoted SKUs — evidence of upsell/impulse lift
- Bounce/exit rate from a zone — are people leaving before engaging?
Use heatmaps + POS/POS-linked SKU data to link visibility → engagement → purchase.
A simple 5-step layout experiment (playbook)
- Pick a target: choose a product category or display to optimize.
- Baseline: capture 7–14 days of heatmap and sales data.
- Hypothesis: e.g., “Moving this display by 3m into the main flow will increase dwell time by 15%.”
- Act: reposition, adjust lighting/signage, or run a micro-activation.
- Measure & iterate: compare post-change heatmap + POS data; roll out winners.
Repeat this small, fast, measurable loop across stores for continuous improvement.
Design tips to maximize visibility
- Use verticality: tall elements cut through sightlines.
- Contrast matters: good lighting and color contrast help displays pop in heatmaps.
- Keep a clear approach: ensure a 1.2–1.5m clear path so shoppers can stop without blocking flow.
- Signage needs to be readable at walking pace — big, simple messages work best.
Tools + teamwork: where analytics meets execution
Heatmaps are only useful if VM, store ops, and area managers use them together. Set a short weekly sync where: VM shares planned changes, ops checks staffing, and data owners present recent heatmap trends. That cross-functional loop turns insight into on-floor action.
Let data shape your next layout refresh
That beautiful new display isn’t helping if no one sees it. Heatmaps and dwell-time analytics give visual merchandisers and store managers the evidence they need to place products where they’ll be noticed — and sold. Start treating your store like a living map: observe, test, move, measure, repeat.
Contact – Skywave to map your in-store traffic and run your first layout experiment.
![]()
![]()
![]()
![]()
![]()
![]()
![]()