For many retail teams, store layout decisions are based on experience, intuition, or visual merchandising guidelines. While these methods work to a degree, they often miss a critical element: how customers actually move through the store.
That’s where retail heatmaps and dwell-time analytics come in.
When used properly, heatmaps transform raw foot traffic data into clear insights that help visual merchandisers and store managers optimize layouts, improve engagement, and ultimately increase sales.
This article explores how retail teams can move from simply arranging products to building data-driven sales floor strategies.
The Hidden Problem: Dead Zones in Retail Stores
Even the most beautifully designed store layouts often contain dead zones—areas where customers rarely walk or spend time.
Dead zones can appear for several reasons:
- Poor product visibility
- Awkward fixture placement
- Narrow aisles or blocked sightlines
- Low-interest product categories
- Store entrances directing traffic in only one direction
These spaces silently reduce the effectiveness of your store because valuable floor space isn’t contributing to sales.
Without customer movement data, these areas are difficult to identify. They might look fine visually but receive very little shopper engagement.
This is where heatmaps reveal what the human eye cannot.
What Retail Heatmaps Actually Show
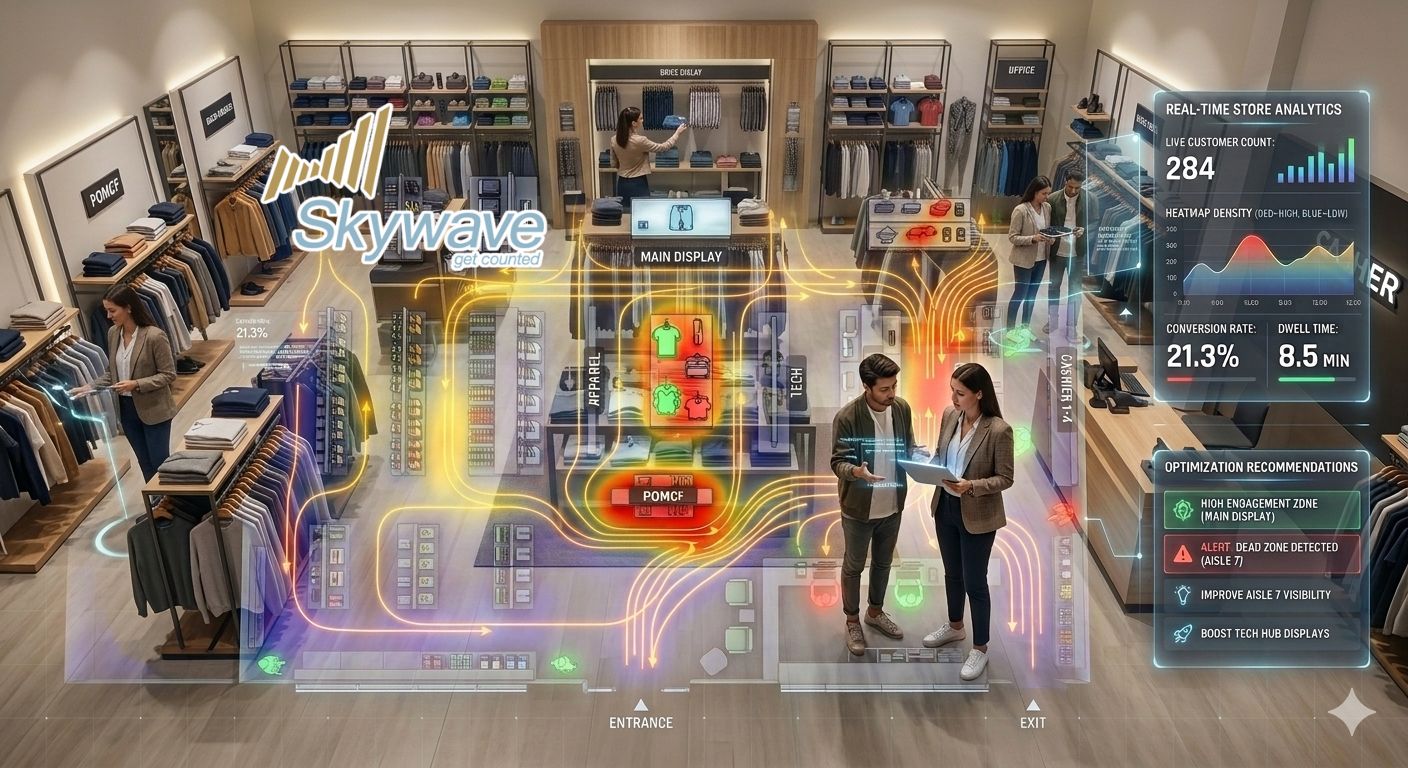
Retail heatmaps visualize customer movement patterns inside the store. Using sensors or AI-powered analytics, they track where shoppers walk, pause, and interact.
Instead of guessing where customers go, heatmaps clearly display:
- High traffic zones – areas where most customers pass
- Engagement zones – where shoppers stop and browse
- Low traffic areas – sections that receive minimal attention
- Movement patterns – typical paths customers take from entrance to checkout
When combined with dwell-time data, retailers gain an even deeper understanding.
Dwell time measures how long shoppers stay in a specific area, which helps teams evaluate:
- Which displays capture attention
- Which product areas encourage browsing
- Where customers quickly pass through without engagement
This combination turns simple traffic data into actionable layout intelligence.
Turning Heatmap Insights Into Layout Improvements
Data alone doesn’t improve stores—the actions taken from that data do.
Retail teams can use heatmap insights to make targeted layout adjustments that improve customer flow and product exposure.
1. Fix Dead Zones
Once dead zones are identified, teams can experiment with layout changes such as:
- Moving promotional displays into low-traffic areas
- Relocating popular categories to attract movement
- Adjusting aisle structures to guide customer flow
Small changes can significantly increase engagement in previously ignored areas.
2. Reposition High-Value Products
Heatmaps reveal prime real estate inside the store.
High-margin or promotional products should be placed in:
- High traffic pathways
- Natural pause points
- Areas near entrances or transitions between sections
This ensures that the products retailers want to push are seen by the highest number of customers.
3. Optimize Visual Merchandising Displays
Visual merchandising teams can use heatmaps to evaluate whether displays actually work.
Questions heatmaps help answer:
- Do shoppers stop at the display?
- Are customers bypassing it completely?
- Does repositioning increase dwell time?
Instead of relying solely on visual appeal, teams can measure actual shopper behavior.
4. Improve Store Navigation
Some layouts unintentionally create traffic bottlenecks or confusion.
Heatmaps highlight areas where customers:
- Turn around frequently
- Avoid certain aisles
- Move quickly without browsing
These insights allow store managers to simplify navigation and make the shopping experience smoother.
Measuring the Sales Impact
The ultimate goal of layout optimization is not just improved traffic flow—it’s better sales performance.
Retailers that use heatmaps strategically often see improvements in:
- Product visibility
- Customer engagement
- Conversion rates
- Basket size
For example:
- A dead zone converted into a promotional display area may increase product exposure.
- Moving a best-selling category into a high traffic area can lift conversion.
- Adjusting aisle layouts may encourage shoppers to explore more of the store.
By connecting footfall data with sales data, retailers can identify which layout changes deliver real business impact.
Moving From Layout Design to Sales Strategy
The most successful retailers treat store layout as a continuous optimization process, not a one-time design decision.
Heatmaps enable teams to:
- Identify underperforming areas
- Test layout changes
- Measure shopper response
- Refine the sales floor strategy
This approach turns store layouts into data-driven performance tools, rather than static visual plans.
The Opportunity for Retail Teams
For visual merchandisers and store managers, the challenge isn’t designing attractive stores—it’s ensuring that every square meter of the store contributes to sales.
Heatmaps and dwell-time analytics provide the missing link between store design and customer behavior.
When retail teams understand how shoppers actually move through their stores, they can make smarter decisions about:
- Product placement
- Display positioning
- Traffic flow
- Promotional zones
The result is a store layout that not only looks good—but actively drives revenue.
Final Thoughts
Retail space is valuable. Every corner of the store should have a purpose.
Heatmaps help retail teams uncover hidden opportunities by revealing:
- Where customers go
- Where they stop
- Where they ignore
With these insights, stores can evolve from static layouts into strategic sales environments designed around real shopper behavior.
If your team is exploring ways to improve store performance, heatmap analytics can provide the clarity needed to turn layout decisions into measurable results.
Turn customer movement into actionable retail insights. Contact – Skywave
![]()
![]()
![]()
![]()
![]()
![]()
![]()